|
Among
the data currently employed to quantify the discrimination against
women, the demographic statistics of a population, among which
is the sex ratio (SR) are a good reflection of the status of
women in a society. The sex ratio will be calculated as the
number of women per 1000 men (female to male ratio). This choice
makes the analysis of the observed deficit of women in India
much easier than the usual SR (male to female ratio) calculation.
The sex ratio is, in effect, a crucial variable in the determination
of an eventual inequality between men and women according to
the group under consideration (population according to age,
urban population, literacy, etc.). It is, however, a complex
product of different factors: sex ratio at birth, differential
mortality according to sex, and migrations. The latter element,
which is above all economic in nature, is responsible for a
significant part of the observed ratio variations.
The
sex ratio of the Indian population has been diminishing almost
regularly since 1901, due to the decline of the sex ratio of
the population from 0-6 years of age, particularly in certain
regions of the country. And these results are the reflection
of the role and status of females in India (social, economic
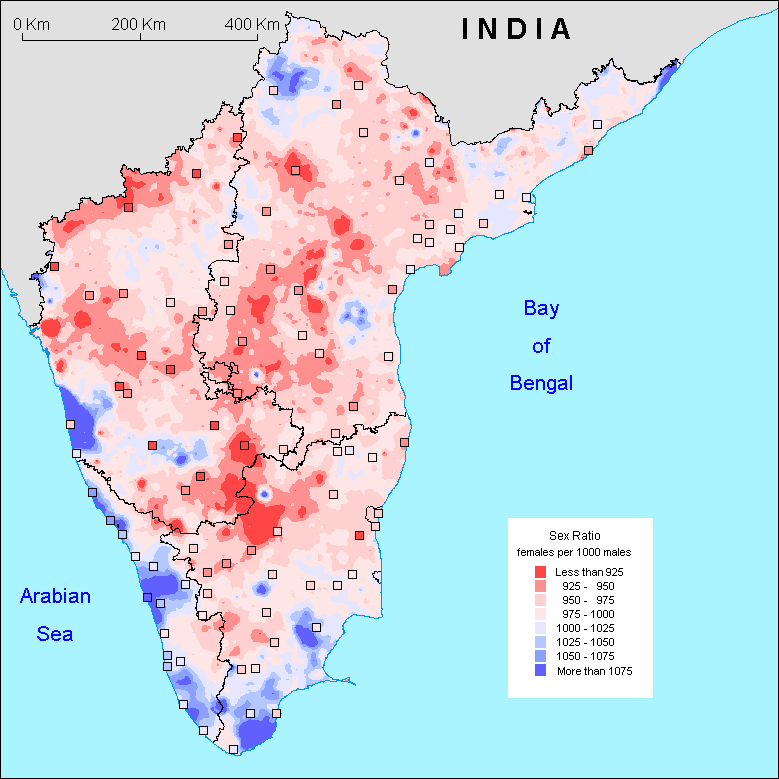
and cultural discriminations). So this map is to be linked with
factors of development in South India. The sex ratio is unbalanced
because of different factors like neglect of girl child resulting
in their higher mortality at younger ages, high maternal mortality,
sex selective female abortions, female infanticide, change in
sex ratio at birth, sex selective migration and sex differential
in population enumeration. The most developed states: Kerala
and Tamil Nadu, especially for social development, are distinguished
by high sex ratios over large areas. But migrations play a big
role also. Between two factors that are migration and social
development, it's difficult to know which is the most important.
Especially in the case of Kerala, where there are linked and
the male migration massive, so that it seems that men are missing!
Generally
sex ratio is comprised between 950 and 975 but we remark some
low sex ratios pockets. As we can see on this map, the sex ratio
is quite unbalanced in the center of South India, especially
in Karnataka and Andhra Pradesh and at the hilly frontier of
Karnataka and Tamil Nadu. Only Kerala is not concerned. So out
of the four states, only one, Kerala shows a high homogeneous
sex ratio. In opposition to Kerala, one shows very low sex ratios,
namely Andhra Pradesh. Generally, the South of South India shows
high sex ratios whereas the North is characterized by lower
sex ratios. In India, the sex ratio was 927 women per 1000 men
in 1991 and 933 in 2001, whereas in South India it was 985 in
1991 and 996 in 2001.
S.V.
|

