|
Atlas
of South India - 1991
|
|
|
|
Mapping
the data
|
|
|
Maps shown
in this atlas are constructed with the SIFP
database. Data are presented here. Four
steps are necessary to go from the original data to the final
maps.
|
|
|
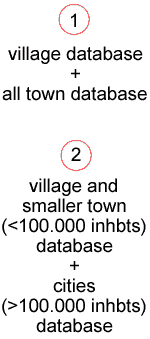
1st
step : urban rural dichotomy
At
the beginning, the SIFP database had two separate layers:
one containing the villages of South India, the other
containing the towns. However, small towns were too numerous
to be mapped in a proper way and it was decided to merge
them with surrounding rural areas.
The first step consisted in separating the cities (towns
with more than 100.000 inhabitants) from the other towns.
Cities have been mapped under squared form (if you roll
over a square with your mouse, the name of the city will
appear).
The other towns (with less than 100.000 inhabitants) have
been merged in the village database. Therefore we now
have 2 new superimposed layers, which will be mapped separately,
but following the same classification, so that we can
use the same legend for both.
As a result, only cities appear in the foreground, the
other towns are embedded in the background map.
|
 |
|
|
|
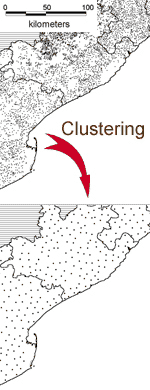
2nd
step : clustering
The
entire database contains more than 75.000 units. Hence
it is impossible to map out all these data in a visually
useful manner. Furthermore, the variation of population
and surface from one village to the other is so huge that
the Modifiable Areal Unit Problem forbids any interpretation
of the maps (for details about the MAUP see Openshaw,
1984).
That's
why we decided to aggregate the data, in order to obtain
less units to map. This method, called "clustering",
was designed by Christophe Z Guilmoto and is described
in Guilmoto et al. (2003 & forthcoming). This process
really diminishes the number of units, but respects each
demographic weight (as it is an aggregation) and the geographical
location of the units (as it is spatially restricted).
Using the clusters has a direct impact on the statistical
robustness of the data, particurlaly because of the decrease
in the data variability (in particular, the method reduces
drastically the role of the outliers).
|
 |
|
|
|
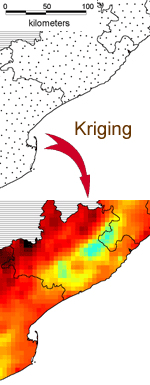
3rd
step : kriging
To
map the clusters, we used a method of spatial smoothing
called ordinary kriging (for further details see Burrough
& McDonnell, 1998, page 132 and following). Kriging is
an exact estimation method, which means that it retains
original observed values without smoothing them out. The
interpolation is only on the unknown surface. The spatial
repartition of the phenomena is then not modified, unlike
other methods like modelling based on potentials. Last,
the procedure is based on a spatial autocorrelation analysis
of the phenomena, since the modelling is based on the
semivariance of the data. An example of cartography using
kriging is proposed by Oliveau (2003).
|
 |
| |
|
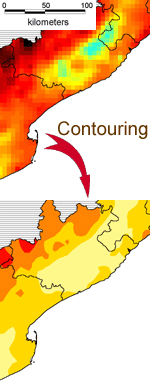
4th
step : contouring
The
map we obtain is then contoured to get classified color
areas, which are easier to read than a continuous range
of color.
|
 |
| |
|
A
brief note about the names
Names
given on the maps are from different sources. As the spelling
of names is often changing in India, we tried to put the
official one or the most commonly used. For example, Madras
is officially called Chennai, and everyone in South India
knows it, so we kept Chennai. The river Cauvery may be
found as Kavery, but the former name is most commonly
used.
Names are from census maps (1991), Lonely Planet road
atlas (one of the best sources...) and the maps of
the Survey of India (National Atlas of India, Physical,
(1961), plates 33, 34, 35, 36, 37).
|
| |
|
Bibliography
- BURROUGH,
Peter A., MC DONNELL, Rachael, (1998), Principles
of Geographical Information Systems, Oxford University
Press, Oxford, 333 p.
- GUILMOTO,
Christophe Z., OLIVEAU, Sébastien, VINGADASSAMY,
Sattianarayanin (2002), " Un système d'information
géographique en Inde du Sud : Théorie,
mise en œuvre et applications thématiques",
Espace, Populations et sociétés, Lille,
pp. 147-163
- GUILMOTO,
Christophe Z., OLIVEAU, Sébastien, (forthcoming),
" Un système d'information géographique
en Inde du Sud : Théorie, mise en œuvre
et applications thématiques ", Pondy
paper in Social Sciences, French Institute of Pondicherry,
Pondicherry.
- OLIVEAU,
Sébastien, (2003), "Mapping out fertility
in South India: methodology and results", in Guilmoto,
C.Z., RAJAN, I., pp. 147-163
- OPENSHAW,
S., (1984), The modifiables Areal Unit Problem,
Concepts and techniques in Modern Geography 38, Norwich
: Geo books.
|
|
|