|
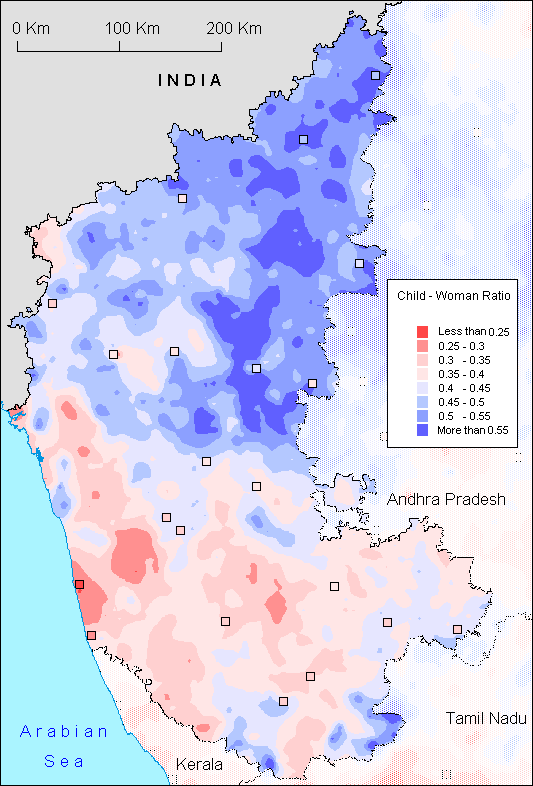
The map of child-woman ratios in Karnataka puts a figure to the fertility gap between regions within the State. Though fertility in Karnataka as a whole is lower than the national average, the map displayed shows significant differences in fertility levels between the North and the South of the State. Topping the list are the north-eastern districts of Bidar, Gulbarga, Raichur, Bellary and Bijapur with child-woman ratios that are twice higher than those observed in Dakshina Kannada around Mangalore city.
The
map therefore reflects the extreme regional divide that characterizes
Karnataka, a state that combines underdeveloped areas and the
highly advanced Bangalore region. Fertility in North Karnataka
remains at levels almost comparable to those observed in North
India and this delay in fertility decline is only one component
of a "backward" profile also characterized by low literacy,
predominance of dry agriculture and
urban underdevelopment. But it is not difficult either to recognize
the features of the sociohistorical regions that comprise Karnataka,
with the highest fertility observed in the Hyderabad Karnatak
(also known as Deccan Karnataka or northern Maidan) that became
entirely part of the Deccan Sultanates after the fall of Vijayanagar.
Isolated pockets of high fertility may also be distinguished
in tribal areas along Kerala and Tamil Nadu as well as around
northern Konkan towns such as Bhatkal that have a high share
of Muslim population.
Low fertility is on the contrary concentrated in the coastal plains (Konkan), along the Ghats (Malnad) and in the old Mysore region (southern Maidan). It is also worth stressing that in spite of its rapid economic development, the lowest fertility is not recorded in the high-profile Bangalore metropolitan region where birth rates are clearly higher than in the South-West.
C.Z.G.
|