South Indian Population Information System
| | A sample of SIPIS maps | |
- taluks of Tamil Nadu
- literacy and sex ratio in Salem
- deficit of girls in Madurai region
- roads and villages in Thanjavur
- Urban areas and elevation around Coimbatore
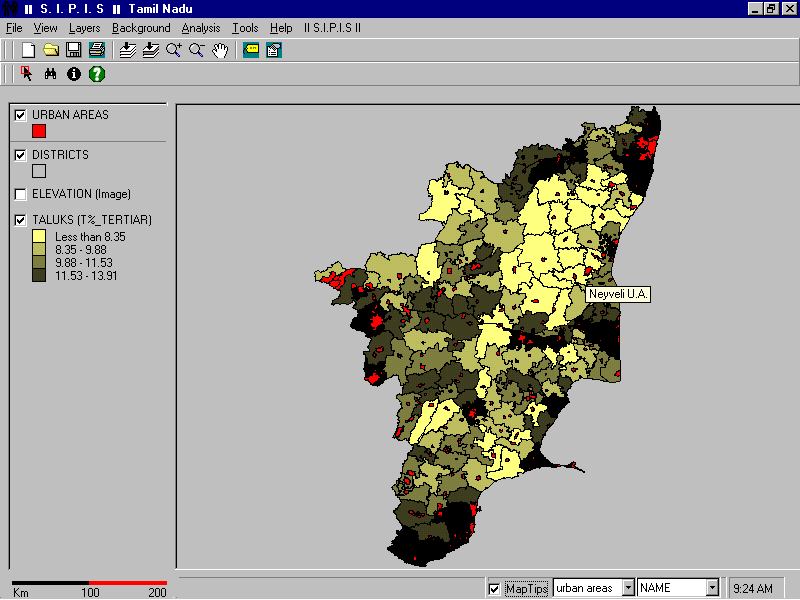
A taluk-level analysis of the
proportion of the labour engaged in service activities. Urban areas are
shown in red. Elevation map is not shown. The map tip options shows information
(here name of town) at the cursor location (here Neyveli Urban Agglomeration).
This map displays villages and
the sex ratio of the literate population. As a background map, we have
put the trend map of sex ratio in the Salem area of Tamil Nadu.
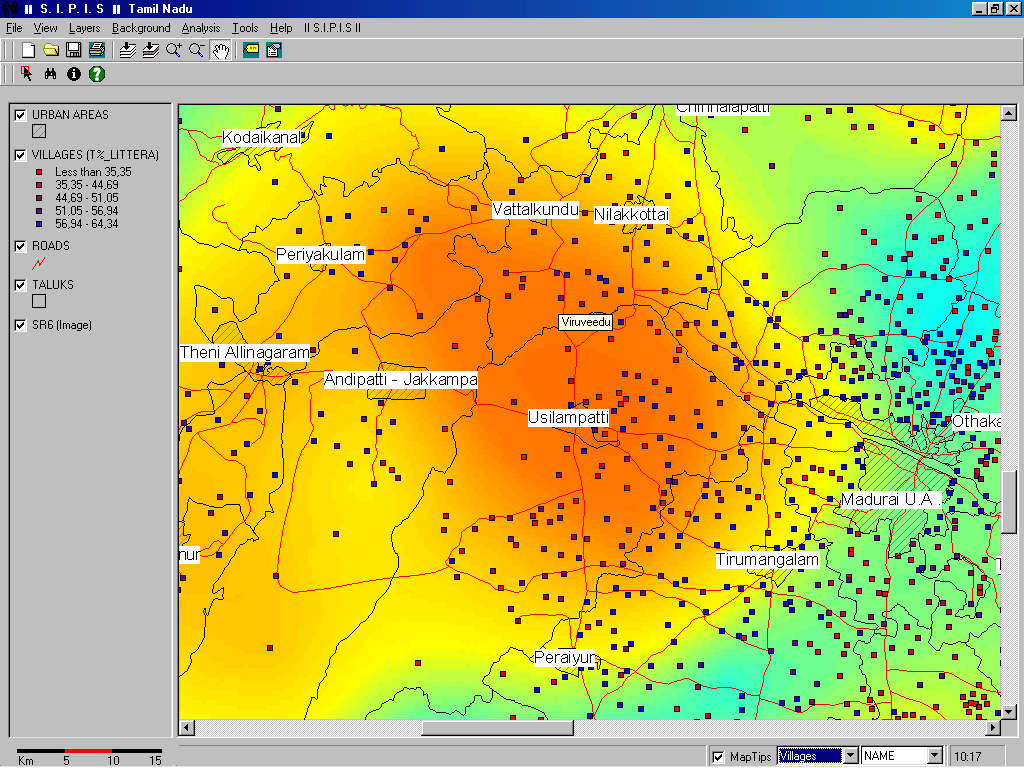
This map shows the Usilampatti
area near Madurai, with rural literacy rates. Town names, road and taluk
boundaries are added. The background map is the trend map of sex ratio
below six. Lower proportions of girls are shown in red (normal values are
in green). This map illustrates the dramatic deficit of girls in this rural
area.
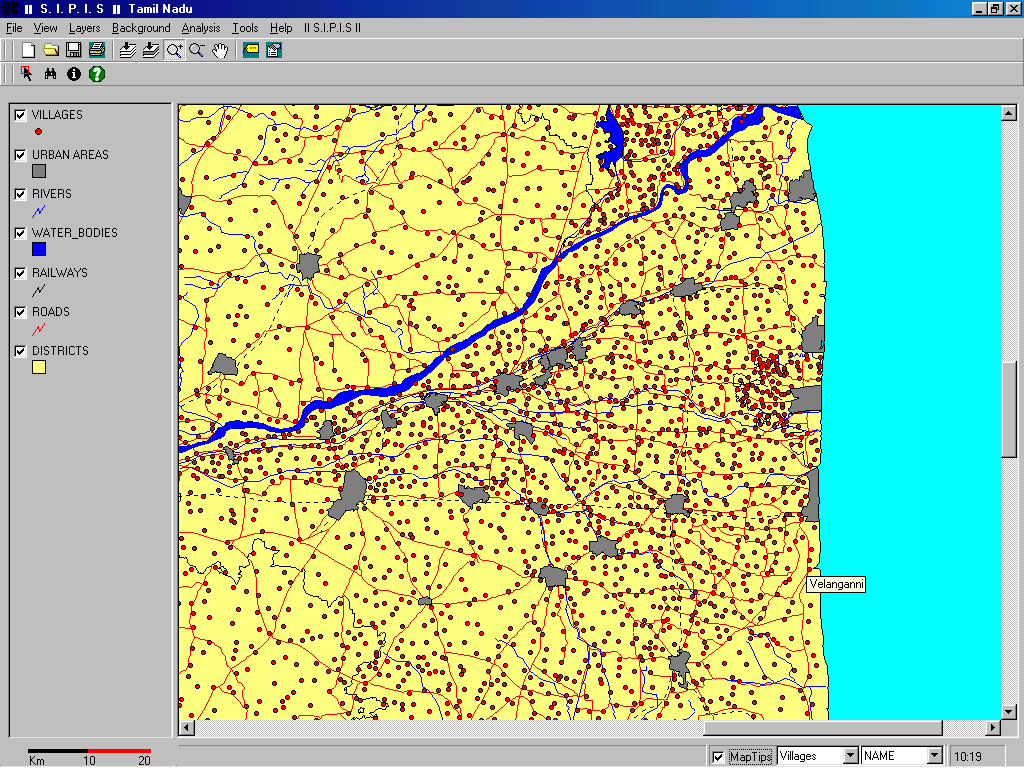
This is a basic map of villages
in the Thanjavur area with other information shown such as water bodies,
administrative boundaries, etc.
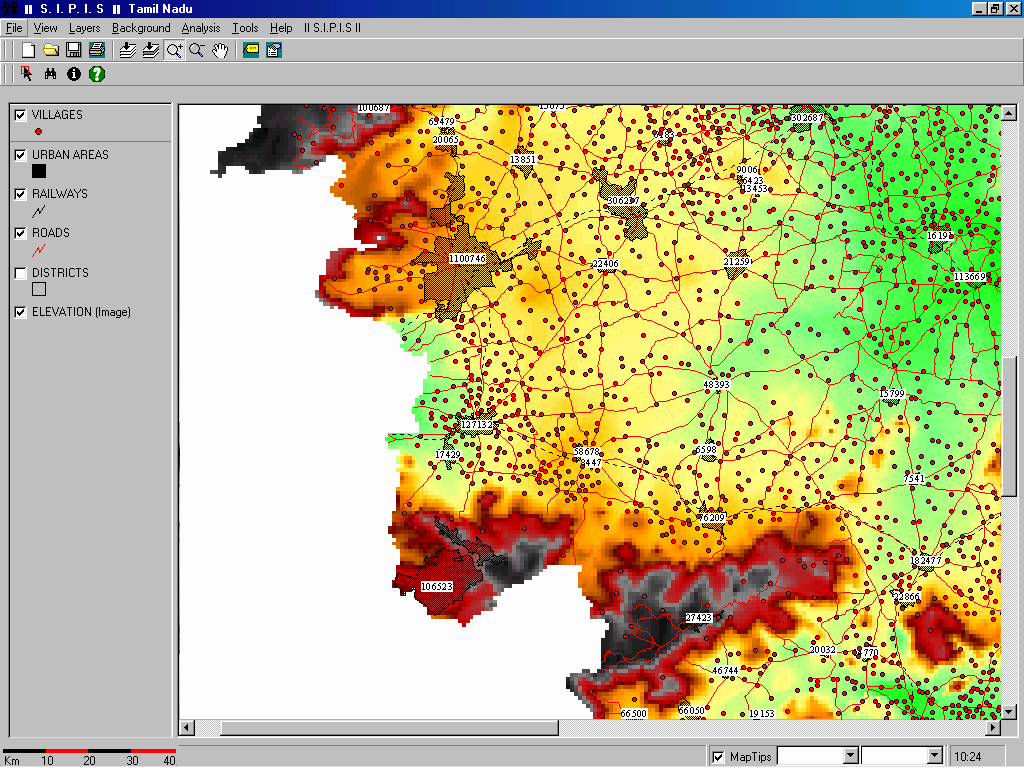
This is a map of Western Tamil
Nadu, where the neighbouring State of Kerala is shown in white.The figures
of total population for all urban areas are displayed (Coimbatoire city
has a 1100746 population). Elevation is also shown as a background image.