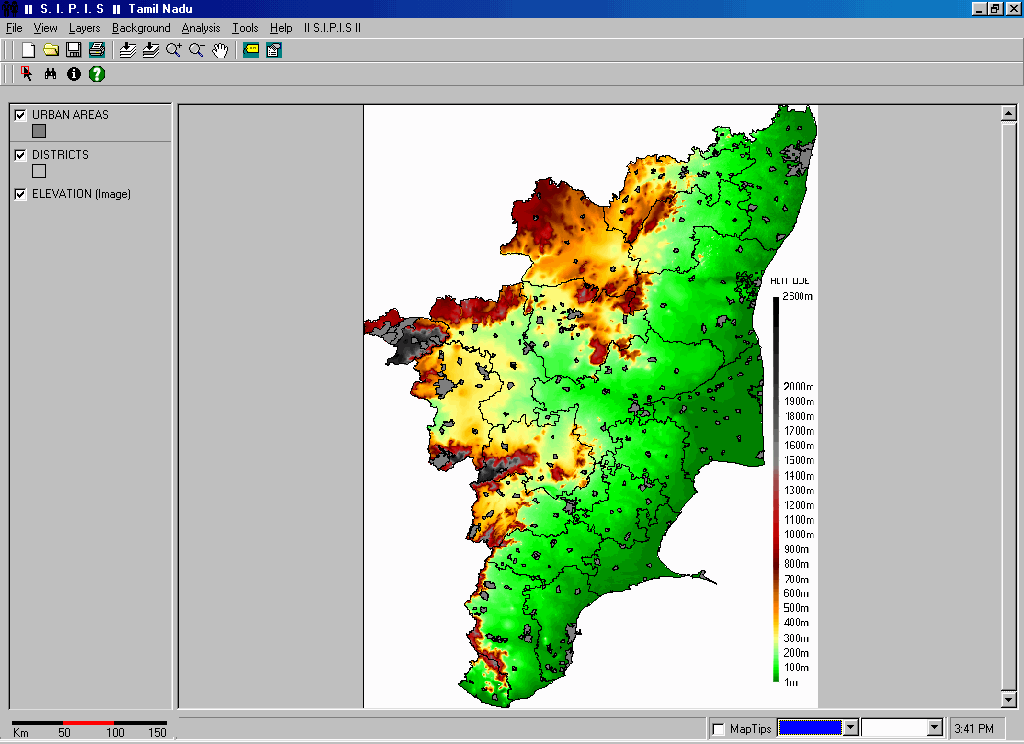
SIPIS has been designed to be user-friendly and to allow inexperienced end users to look at maps and data. You first have to install SIPIS on your PC-compatible computer using your CD drive. The Set-up programme will prompt you through the installation process (see Installing SIPIS).
 When
you launch SIPIS, the first screen you see is a default map of Tamil Nadu
as shown on the left. The main SIPIS window has a command menu at the top.
Below this menu are icons that represent short-cuts to many useful functions
such as zooming or moving around your map, searching for localities or
printing your windows.
Each map is a combination of layers that correspond to geographical objects such as administrative boundaries, urban and rural localities, roads, railways, drainage system, etc. On the left, in the legend bar, you will recognize the name of the different layers that compose each map. A scale bar in km is also provided.
- Finding a locality on your map
To find a particular place, use the Find button, by entering the village or taluk name. You may also check on the map tips facility on the lower right of your map and select the information you want to display temporarily on the map such as town names (default).
- How to change a map with SIPIS?
Ordinary layers can be changed in many ways, by changing the appearance of each map unit or adding text labels onto the map.
Background (picture) maps such as for irrigation percentage, population sex ratio or elevation have been prepared by the SIPIS team and may not be changed at all.
To change the appearance of a layer,
you first have to double-click on the layer's names in the left window.
You may then choose different ways to change your map such changing the
style or the labels. SIPIS allows you also to perform a data analysis and
to map the results as shown on the sample map of South Tamil Nadu.
Other features of SIPIS include:
- Printing maps.
- Saving map projects that can be used later.
- Saving maps as pictures (BMP and EMF format).
- Zooming to specific areas or perform queries to select localities with specific features.
- Retrieving data about localities by pointing to them with the information button
- Viewing the full table of data.
For more information, you can use the help menu of SIPIS. However, SIPIS is so easy to use that you won't need it very often...